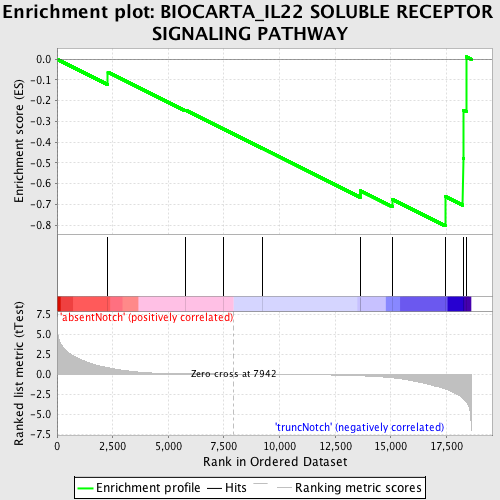
Profile of the Running ES Score & Positions of GeneSet Members on the Rank Ordered List
| Dataset | Set_03_absentNotch_versus_truncNotch.phenotype_absentNotch_versus_truncNotch.cls #absentNotch_versus_truncNotch.phenotype_absentNotch_versus_truncNotch.cls #absentNotch_versus_truncNotch_repos |
| Phenotype | phenotype_absentNotch_versus_truncNotch.cls#absentNotch_versus_truncNotch_repos |
| Upregulated in class | truncNotch |
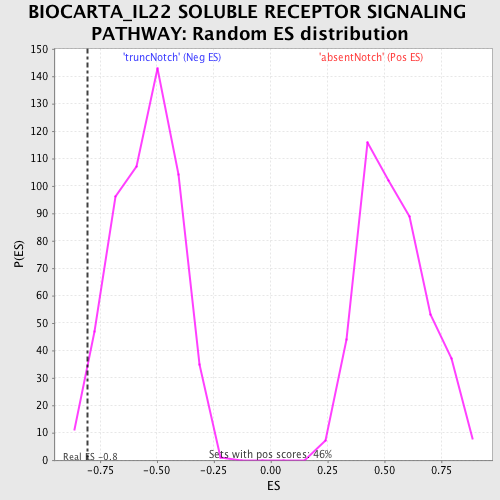
| GeneSet | BIOCARTA_IL22 SOLUBLE RECEPTOR SIGNALING PATHWAY |
| Enrichment Score (ES) | -0.8040694 |
| Normalized Enrichment Score (NES) | -1.463149 |
| Nominal p-value | 0.02757353 |
| FDR q-value | 0.6198869 |
| FWER p-Value | 1.0 |
| PROBE | DESCRIPTION (from dataset) | GENE SYMBOL | GENE_TITLE | RANK IN GENE LIST | RANK METRIC SCORE | RUNNING ES | CORE ENRICHMENT | |
|---|---|---|---|---|---|---|---|---|
| 1 | STAT3 | 460040 3710341 | 2286 | 0.801 | -0.0620 | No | ||
| 2 | IL22RA1 | 5720603 | 5772 | 0.046 | -0.2458 | No | ||
| 3 | IL22 | 1660102 | 7496 | 0.008 | -0.3378 | No | ||
| 4 | IL22RA2 | 460113 | 9215 | -0.021 | -0.4285 | No | ||
| 5 | JAK1 | 5910746 | 13622 | -0.207 | -0.6495 | No | ||
| 6 | STAT5B | 6200026 | 13637 | -0.210 | -0.6344 | No | ||
| 7 | STAT1 | 6510204 6590553 | 15078 | -0.460 | -0.6767 | Yes | ||
| 8 | IL10RA | 1770164 | 17448 | -1.864 | -0.6623 | Yes | ||
| 9 | TYK2 | 1660465 1740736 | 18244 | -2.995 | -0.4772 | Yes | ||
| 10 | SOCS3 | 5550563 | 18263 | -3.056 | -0.2456 | Yes | ||
| 11 | STAT5A | 2680458 | 18406 | -3.478 | 0.0113 | Yes |